Most of the time, issues you may be experiencing with your campaign can be resolved quickly and easily. Here are a couple of tips to help expedite the process:
Facebook Debugger Tool
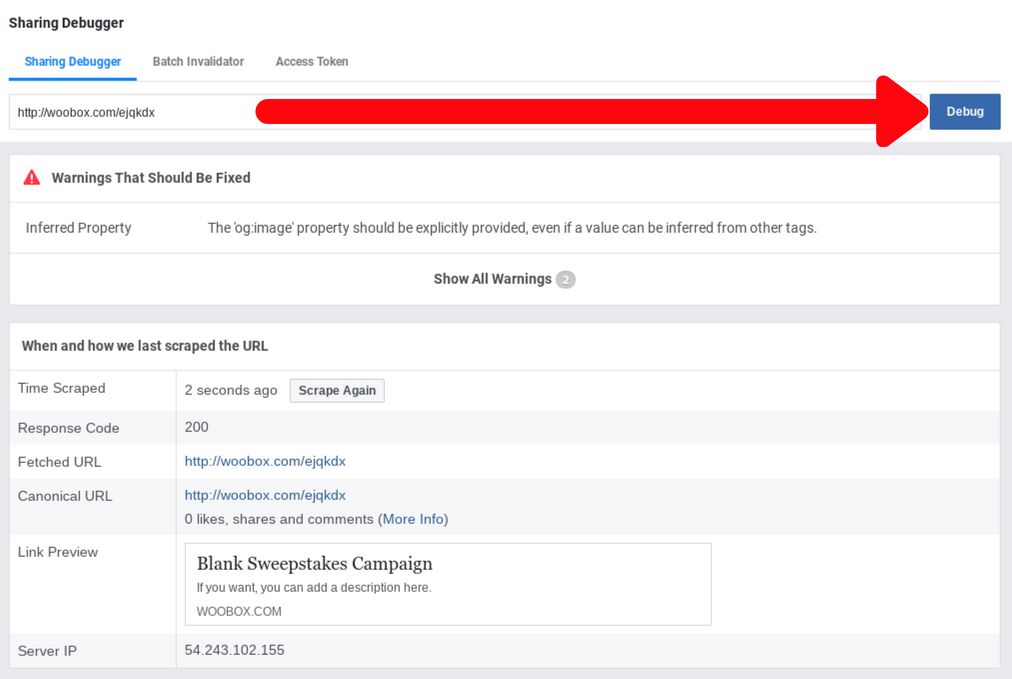
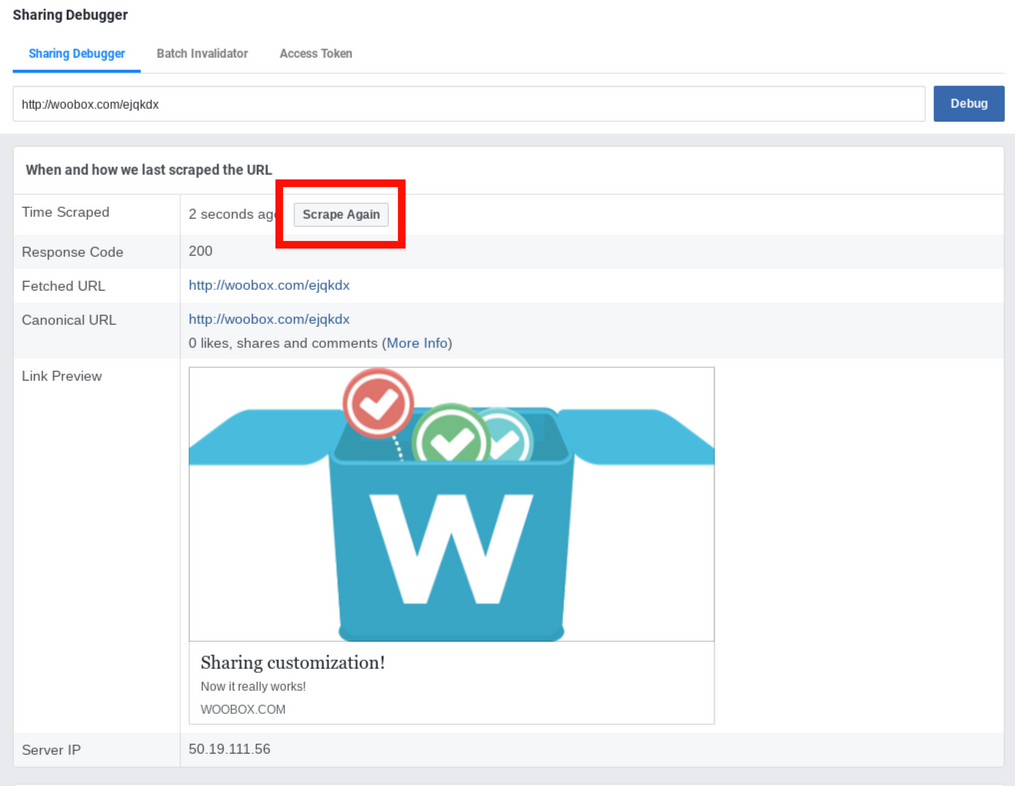
If you’re having issues with the image or text (share dialogue) when you share your campaign URL on Facebook, Twitter, or anywhere that supports open-graph sharing, Facebook provides a free tool that usually solves these issues instantly. Say for instance that when you share the link, the wrong image appears in the post. Just go to the Facebook Debugger Tool, paste in the campaign URL (this does not have to be a Facebook URL) and hit “Debug”.


The debugger tool can be found at https://developers.facebook.com/tools/debug/
Inspect Function
If you are having trouble with a campaign that is embedded on your website (such as styling not rendering properly) we may need to know about any Javascript errors or conflicting code on the site. Knowing about any of these issues when you contact support can help us resolve the problem faster. The way to open this tool varies on each browser.
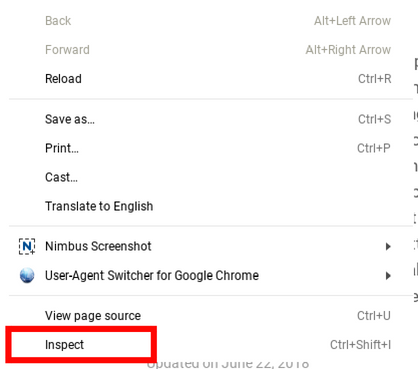
On Chrome: press F12 (Cmd+Option+J on Mac), or right-click and choose “Inspect”.
On Firefox: choose Tools -> Web Developer -> Inspector from the Menu Bar, or press Ctrl+Shift+J (Cmd+Shift+J on Mac).
For Safari on Mac: choose Develop -> Show Error Console from the menu bar, or Option+Cmd+C.

Once the inspector is open, click “Console” at the top of the window. If there are any errors on the page, they will display in the window:

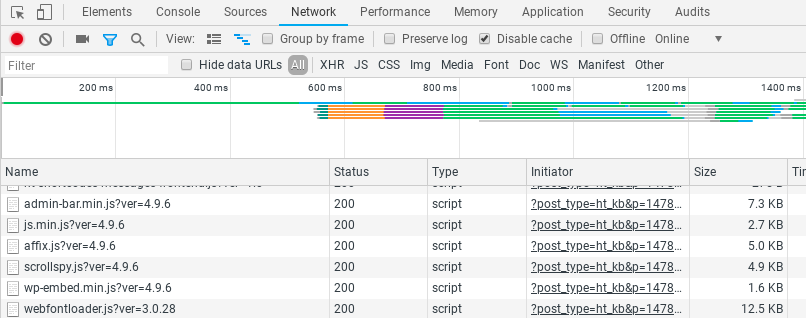
With the “Inspect” feature open, you can also access the Network tab which will display any network errors. The Network tab only shows data from after it’s open, so you will have to refresh the page to see any errors.

Including this information in your call or email to support would be extremely helpful in getting to the bottom of the issue!